Effect of development on average and modal controllability
Note
Relevant publication: Tang et al. 2017 Nature Communications
In this example, we illustrate how average and modal controllability vary as a function of age in a developing sample. The data used here are structural connectomes taken from the Philadelphia Neurodevelopmental Cohort.
Here, our Python workspace contains subject-specific structural connectomes stored in A, a numpy.array
with 200 nodes along dimensions 0 and 1 and 769 subjects along dimension 3:
print(A.shape)
Out:
(200, 200, 769)
We also have demographic data stored in df, a pandas.dataframe with subjects along dimension 0.
Let’s take a peek at age, which is stored in months:
print(df['ageAtScan1'].head())
Out:
0    240
1    232
2    231
3    249
4    234
Name: ageAtScan1, dtype: int64
With these data, we’ll start by calculating average and modal controllability for each subject:
# import
from tqdm import tqdm
from nctpy.utils import matrix_normalization
from nctpy.metrics import ave_control, modal_control

n_nodes = A.shape[0] # number of nodes (200)
n_subs = A.shape[2] # number of subjects (769)

# containers
ac = np.zeros((n_subs, n_nodes))
mc = np.zeros((n_subs, n_nodes))

# define time system
system = 'discrete'

for i in tqdm(np.arange(n_subs)):
    a = A[:, :, i]  # get subject i's A matrix

    a_norm = matrix_normalization(a, system=system)  # normalize subject's A matrix
    ac[i, :] = ave_control(a_norm, system=system)  # get average controllability
    mc[i, :] = modal_control(a_norm)  # get modal controllability
Then we’ll average over nodes to produce estimates of whole-brain average and modal controllability for each subject:
# mean over nodes
ac_node_mean = np.mean(ac, axis=1)
mc_node_mean = np.mean(mc, axis=1)
Lastly, we’ll plot the relationship between age and each metric:
f, ax = plt.subplots(1, 2, figsize=(5, 2.5))
reg_plot(x=df['ageAtScan1']/12, y=ac_node_mean,
         xlabel='Age (years)', ylabel='Average ctrb. (mean)',
         add_spearman=True, ax=ax[0])
reg_plot(x=df['ageAtScan1']/12, y=mc_node_mean,
         xlabel='Age (years)', ylabel='Modal ctrb. (mean)',
         add_spearman=True, ax=ax[1])
plt.show()
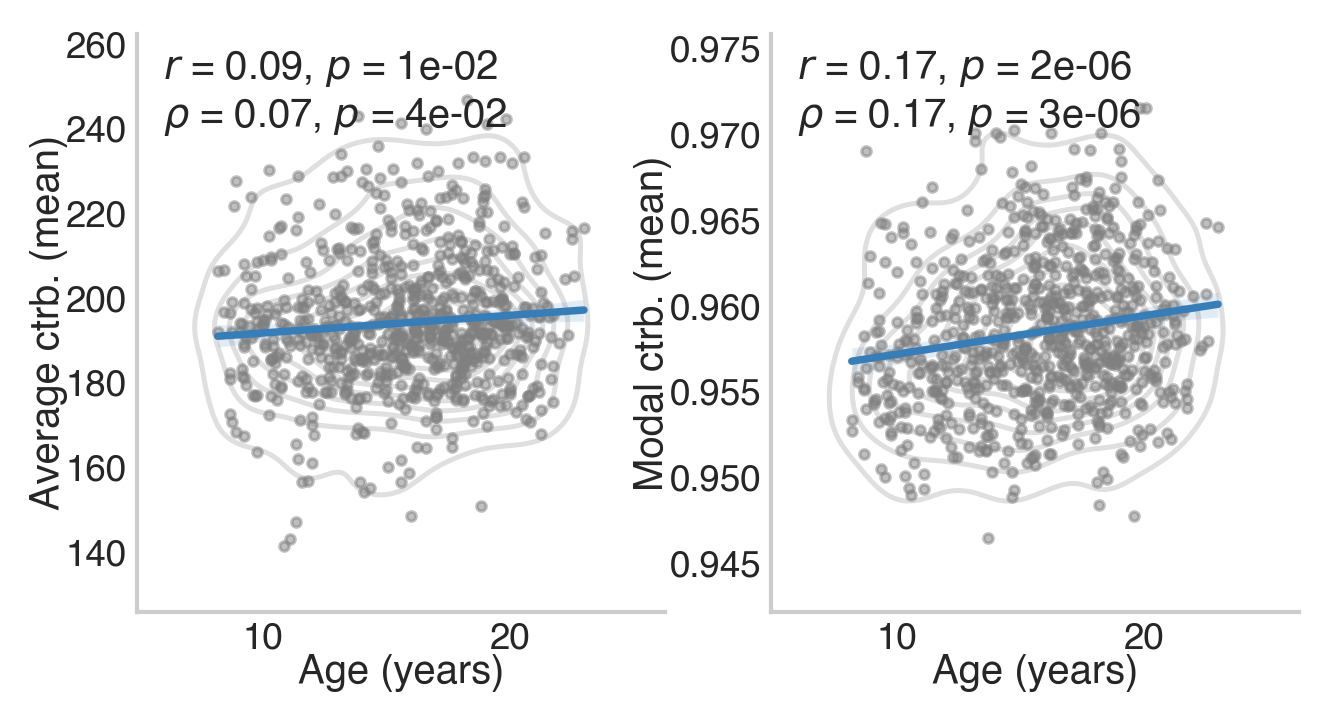
The above figure shows that whole-brain average and modal controllability both increase throughout development. This is consistent Tang et al. 2017 (see Figure 2c for average controllability).